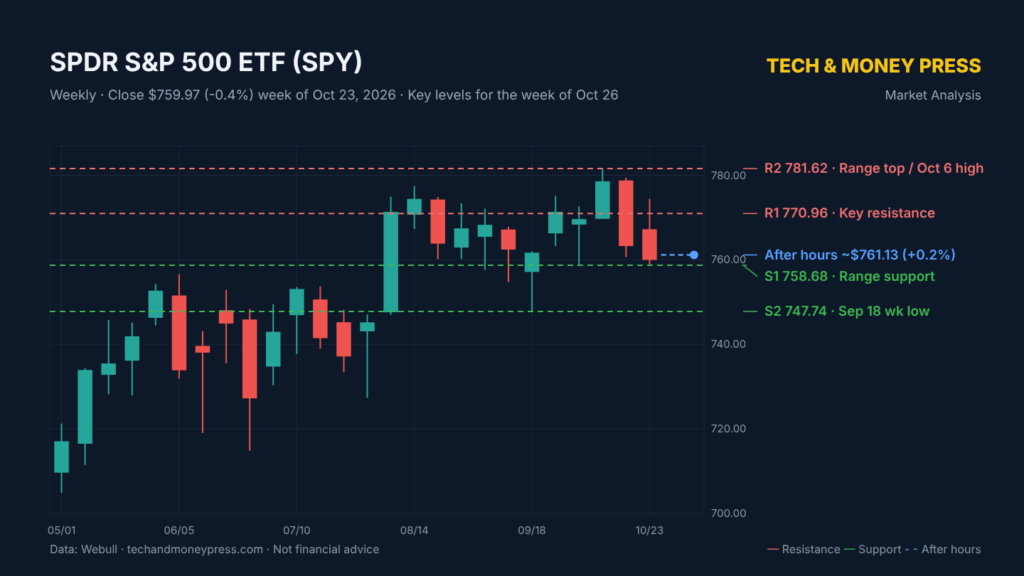
SPY Weekly Analysis: Two Red Weeks Put the S&P 500 at Range Support – Bounce or Breakdown?
By Tech & Money Press · SPY weekly outlook for the week of October 26, 2026
The S&P 500 has now posted two red weeks in a row, and SPY closed Friday right on top of a support level that has held since early October. The big question for this week: is this the bottom of the range and a setup for a reversal, or is support about to break? Here is what the charts show.
Two Red Weeks, Closing Near the Lows
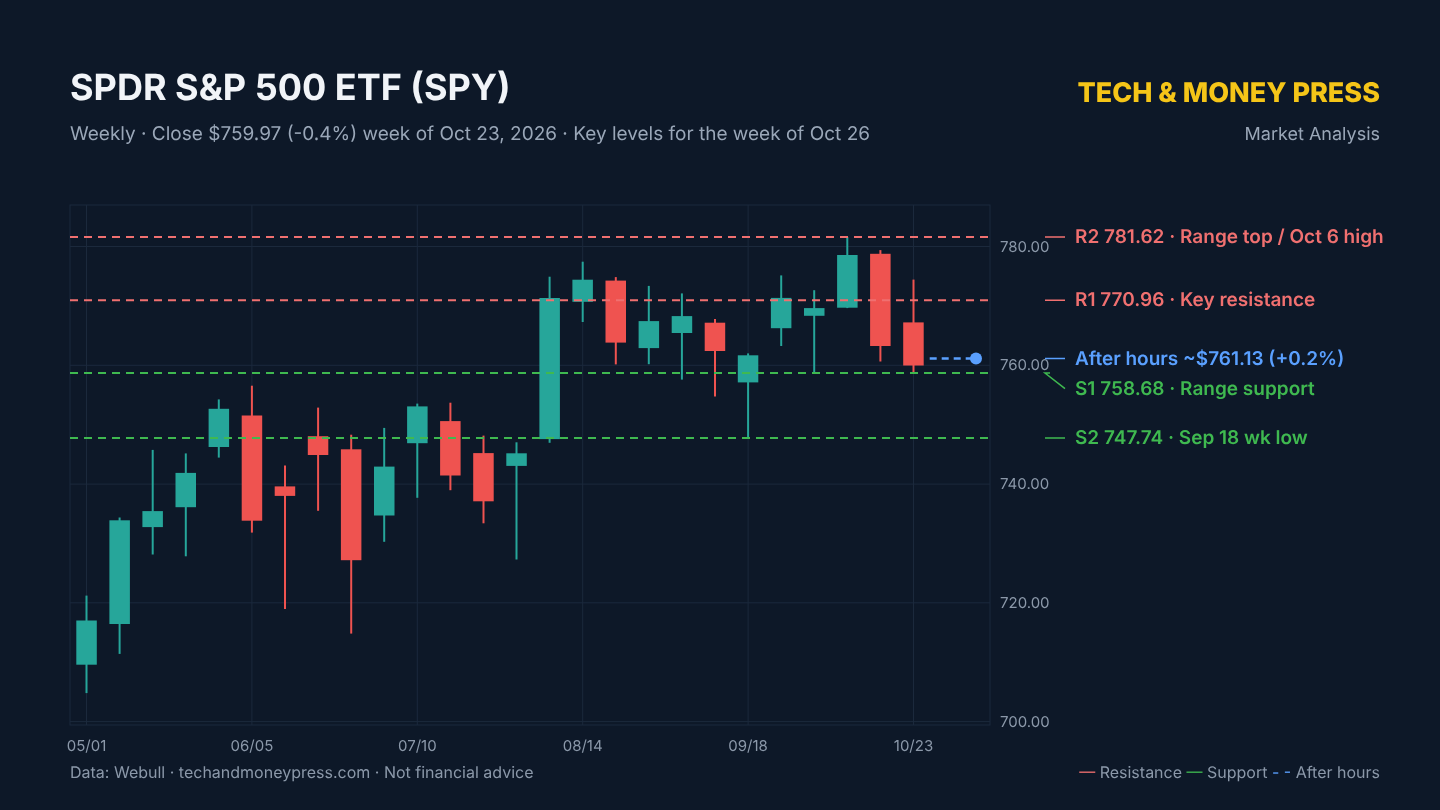
SPY fell 2.0% in the week ending Oct. 16, from $778.57 to $763.25. Last week it slipped another 0.4% to close at $759.97. The weekly close was only $1.29 above the weekly low of $758.68, which means sellers stayed in control into Friday’s close.
The weekly highs are also getting lower: $779.40 two weeks ago, then $774.44 last week. That is not a breakdown yet, but it shows sellers are stepping in at lower prices each time.
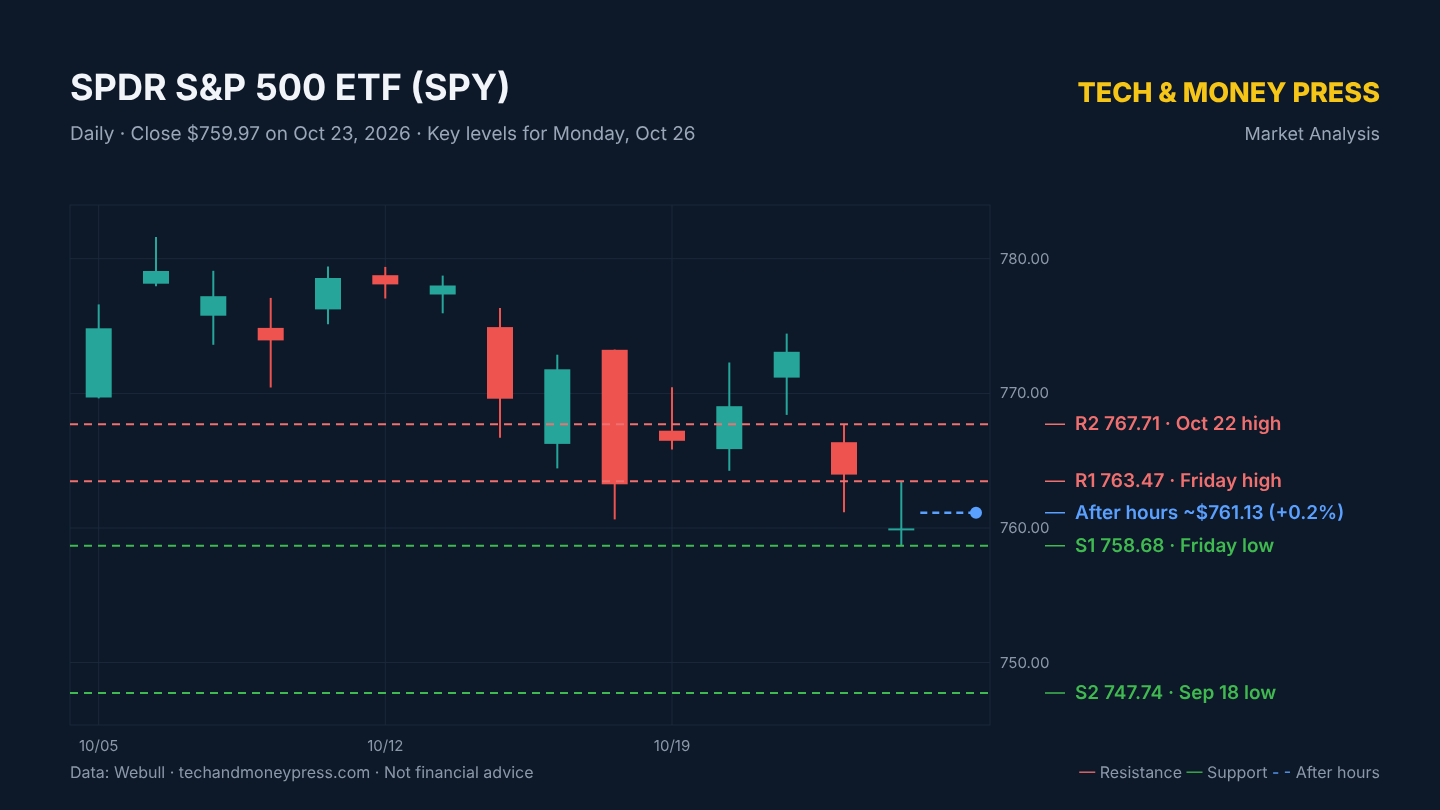
There are two signs the selling may be slowing. Last week’s candle was much smaller than the week before, and volume dropped from about 208 million shares to about 193 million. On Friday, SPY traded in a tight $758.68–$763.47 range and closed almost exactly where it opened ($759.90 open, $759.97 close), forming a doji right on support.
A Two-Month Range With No Clear Trend
Zoom out, and SPY has been stuck in a sideways range since early August, roughly between $747.74 (the Sept. 18 weekly low) and $781.62 (the Oct. 6 all-time high area). Trend-strength readings like ADX are low, which confirms a choppy, range-bound market rather than a trending one.
In a range, the lower boundary often attracts buyers. Right now SPY sits near the lower part of that range, at the $758.7–$758.9 support zone. This zone lines up with the Oct. 2 weekly low ($758.79) and Friday’s low ($758.68).
Key Levels for the Week
- Resistance 2: $781.62 – top of the range and all-time high area
- Resistance 1: $770.96 – key weekly resistance
- Near-term pivots: $763.47 (Friday’s high) and $767.71 (Oct. 22 high)
- Support 1: $758.68–$758.89 – range support / Friday’s low
- Support 2: $747.74 – Sept. 18 low, the floor of the range
Two Scenarios
Bullish reversal: SPY holds $758.7 and reclaims $763.47 (Friday’s high) with strong volume. That would open the way to $767.71 and then $770.96. A weekly close back above $770.96 would put the top of the range ($781.62) back in play.
Bearish breakdown: A daily close below $758.7 would break the support zone. On the weekly chart there is little support between $758 and $748, so a break could move quickly toward $747.74, the floor of the range. That level is where we would watch for the next real bounce.
Our Take
A reversal is possible. SPY is at range support, the market is choppy rather than trending, and the selling is losing momentum. But the short-term structure is still bearish: two red weeks, lower highs and a close near the lows. We would not try to front-run a bounce at support.
Instead, we are waiting for confirmation. A reclaim of $763.47 with volume would favor a bounce toward $770. A daily close below $758.7 would favor a move to $748. In choppy markets, false breaks are common, so a confirmed close matters more than an intraday touch. With a busy week of earnings ahead, expect volatility around these levels.
Disclaimer: This article is for informational and educational purposes only and is not financial advice. Tech & Money Press is not a registered investment advisor. Trading stocks involves risk, including the loss of your investment. Do your own research and consult a licensed professional before making any investment decisions.
Sources: Price data from Webull (weekly and daily bars as of the Oct. 23, 2026 close; after-hours as of 8:00 p.m. ET).