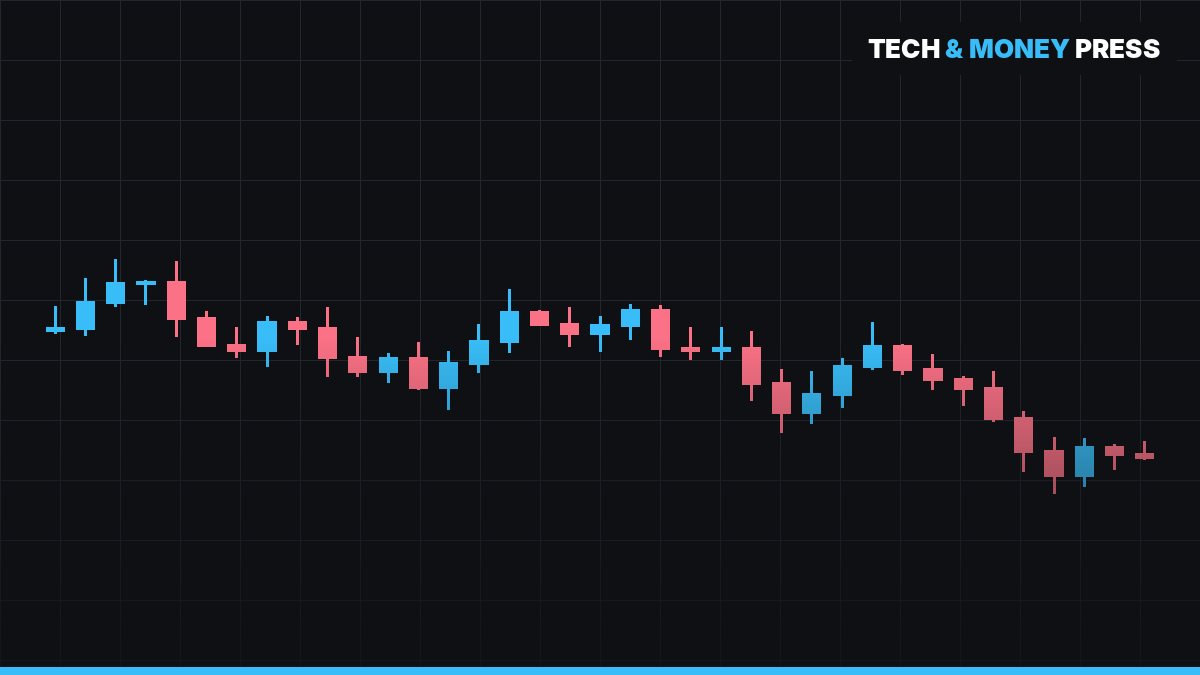
S&P 500 tests 200 SMA and 61.8% Fib resistance: Live levels
Summary
The S&P 500 is currently testing key technical levels, specifically the 200-day simple moving average and the 61.8 percent Fibonacci resistance point. Market participants are monitoring these specific chart indicators to assess the future direction of the index.
Source: Read the full story at Stock Market News
Disclaimer: This content is for informational and educational purposes only and is not financial, investment or trading advice. Tech & Money Press is not a registered investment adviser or broker-dealer. Trading stocks, options and crypto involves substantial risk, including the loss of your entire investment. Do your own research and consult a licensed professional before making any financial decision. The authors may hold positions in the securities mentioned. News summaries are written with AI assistance from the original publisher's report and may contain errors; always check the original source. Full disclaimer.