SPY Weekly Analysis: October Rejection Candle and a Support Break Put $747 in Focus
By Tech & Money Press · SPY weekly outlook for the week of November 2, 2026
Last week we said a daily close below $758.7 would break SPY’s range support and open the way toward $748. That is what happened on Friday. SPY closed its third straight red week below that support, capping a month that ended with a rejection candle at the all-time high, on the heaviest daily volume in more than a month, and now sits just above the floor of its three-month range. With Apple, the midterm elections and the October jobs report all landing this week, here is what the charts show.
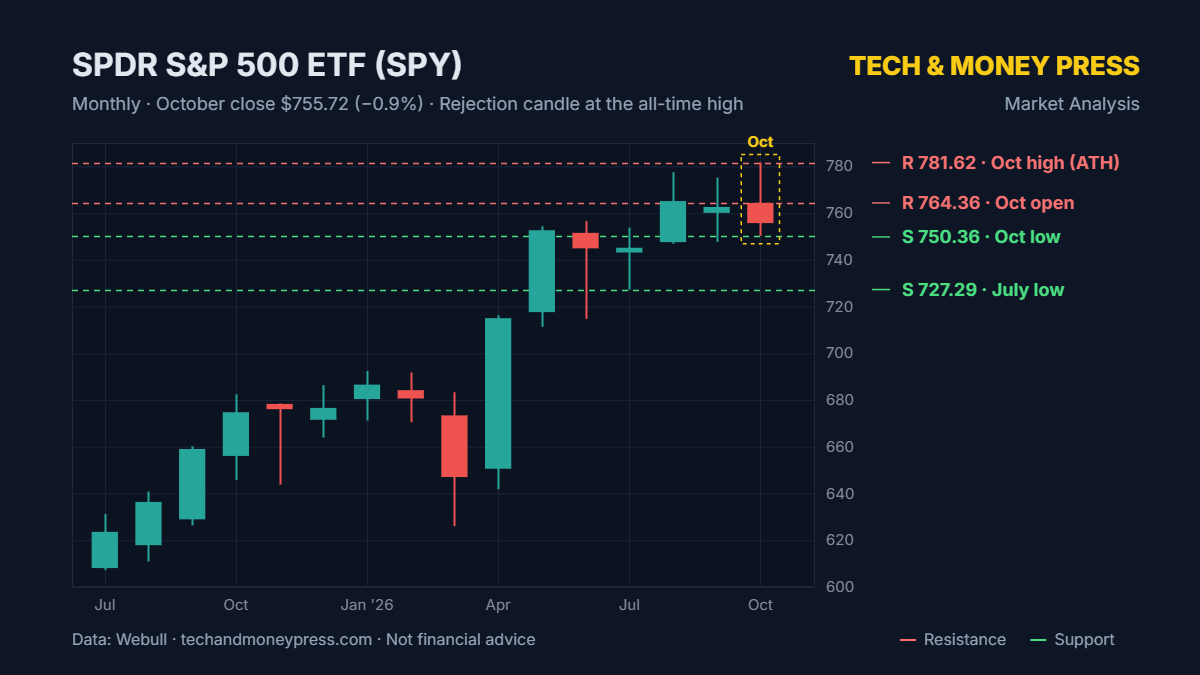
October Closed With a Monthly Rejection Candle
Start with the big picture. SPY opened October at $764.36, made a new all-time high of $781.62 on Oct. 6, and then reversed to close the month at $755.72, down 0.9% from September’s $762.63 close. The October low was $750.36.
That leaves a long upper wick of about $17, more than half of the month’s range and roughly twice the size of the red body, with the close in the bottom fifth of the range. It is a shooting star-style rejection candle at the all-time high, and the first red month since June. A single monthly candle does not confirm a top. It needs follow-through in November: a break below the October low of $750.36 and then the $747.74 range floor, September’s low, would confirm it, while a move back above October’s $764.36 open would weaken the signal.
Three Red Weeks and a Break of Support
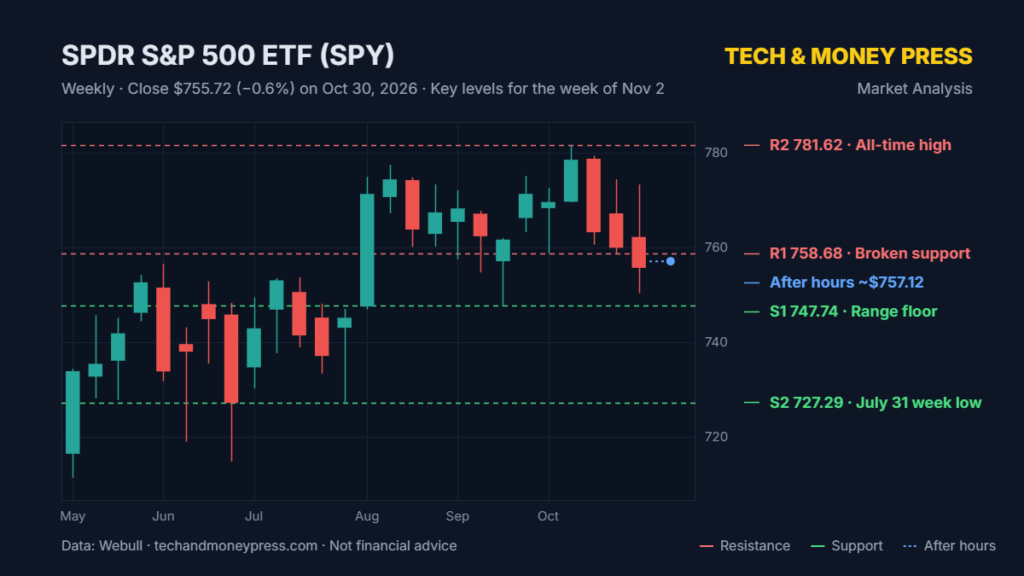
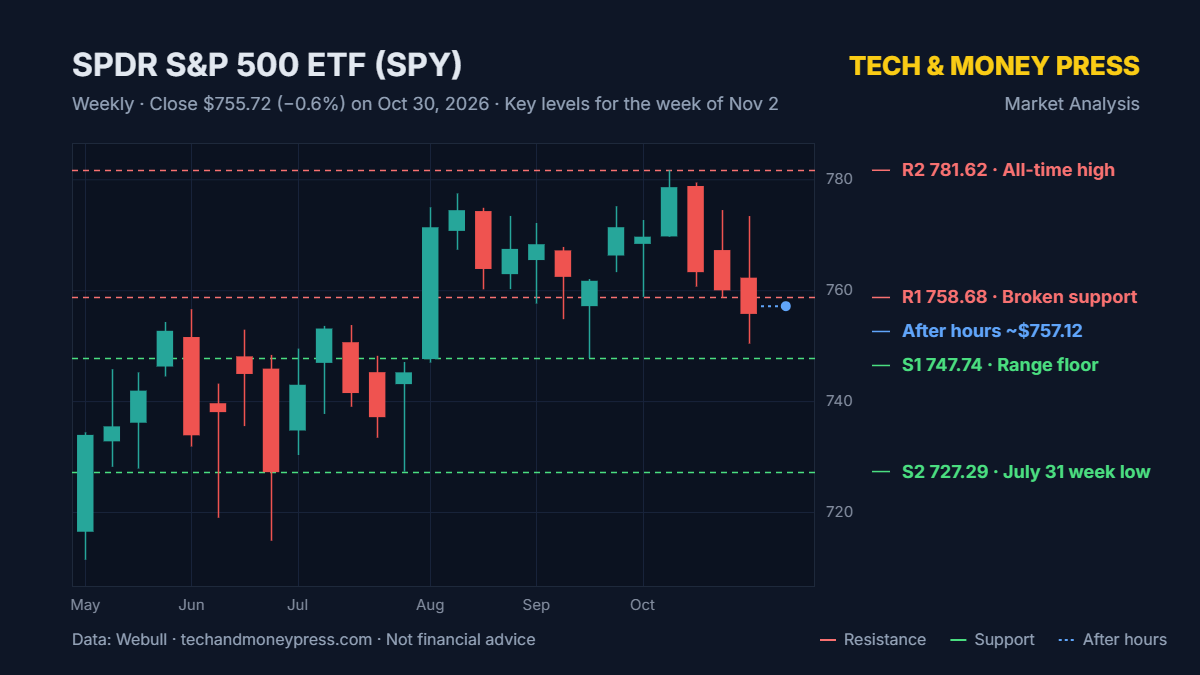
SPY slipped 0.6% last week, from $759.97 to $755.72. That makes three losing weeks in a row: $778.57 on Oct. 9, then $763.25, $759.97 and now $755.72, a total drop of about 2.9%. The weekly highs keep getting lower too, from $779.40 to $774.44 and then $773.36.
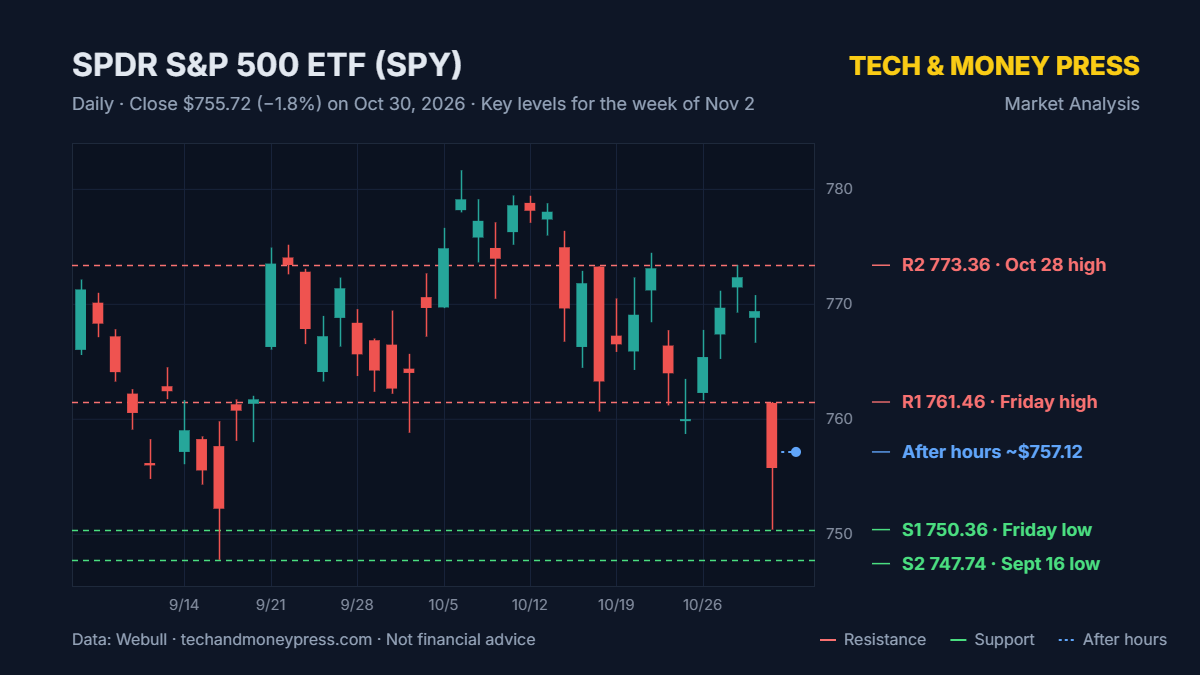
The first four days looked like a bounce. SPY climbed to $773.36 on Wednesday before big tech earnings turned the market. On Friday it fell 1.8% to $755.72, with a range of $750.36–$761.46, as Intel’s weak outlook and Amazon’s revenue miss hit the Nasdaq. Friday’s volume was about 77.7 million shares, roughly twice the usual daily pace, and the weekly close was only $5.36 above the weekly low. That combination, a break on heavy volume with a close near the lows, shows sellers were in control into the weekend. After hours, SPY was near $757.12.
The Range Floor Is the Last Line
Since early August, SPY has traded sideways between roughly $747.74 (the Sept. 16 low) and $781.62 (the Oct. 6 all-time high). Friday’s low of $750.36 came within about $2.60 of that floor. The $758.7 zone that held for most of October, the Oct. 1 low and the Oct. 23 low, is now overhead and should act as resistance on any bounce.
If the floor gives way, the weekly chart shows little support until the July lows, around $727–$733. That is why $747.74 matters so much this week.
Key Levels for the Week
- Resistance 2: $773.36 – last week’s high (the all-time high at $781.62 sits above)
- Resistance 1: $758.68–$761.46 – broken support zone and Friday’s high
- Support 1: $750.36 – Friday’s low
- Support 2: $747.74 – Sept. 16 low, the floor of the range
- Below the range: $727.29 – the July 31 weekly low
A Busy Week of Catalysts
Apple and Palantir report after the close on Monday, and Apple’s report is its first under new CEO John Ternus. AMD reports Tuesday, the same day as the U.S. midterm elections, followed by Qualcomm, Arm and Uber on Wednesday. On Monday morning, the ISM manufacturing index for October also comes out.
Friday brings the October jobs report. Economists expect about 65,000 new jobs after just 29,000 in September, with unemployment holding at 4.2%. The Fed held rates at 3.75%–4.00% on Oct. 28, but markets are pricing a strong chance of a hike in December, and the 10-year Treasury yield ended last week near 4.93%. A hot jobs number would add to that pressure.
Two Scenarios
Bullish reversal: SPY holds $747.74–$750.36 and reclaims $758.7, then closes above Friday’s $761.46 high. That would make Friday look like a false break and put $769–$773 back in play. A strong reaction to Apple’s report would help.
Bearish breakdown: A daily close below $747.74 would break the floor of the three-month range. With little support below, that could open a move toward the July lows near $727–$733, especially if the jobs report pushes yields higher.
Our Take
The structure has turned more bearish. Last week’s breakdown scenario played out, sellers pushed SPY below support on heavy volume, and the weekly chart now shows three red candles with lower highs, and October closed with a rejection candle at the all-time high on the monthly chart. The only thing holding the range together is the $747.74 floor.
We are not trying to call a bottom here. A reclaim of $758.7 with volume would be the first sign that buyers are back. A daily close below $747.74 would confirm the range break. With Apple, the midterms and the jobs report all in one week, expect large swings, and wait for a confirmed close rather than reacting to an intraday move.
Disclaimer: This article is for informational and educational purposes only and is not financial advice. Tech & Money Press is not a registered investment advisor. Trading stocks involves risk, including the loss of your investment. Do your own research and consult a licensed professional before making any investment decisions.
Sources: Price data from Webull (weekly and daily bars as of the Oct. 30, 2026 close; after-hours as of 8:00 p.m. ET). Economic calendar and earnings dates via Seeking Alpha, StockTitan, FXEmpire and Sensei.