Hot CPI Puts Another Fed Hike in Play as 10-Year Yield Hovers Near 24-Year High
By Tech & Money Press · October 14, 2026
September’s inflation report came in hotter than expected, and markets reacted right away. Bond yields swung higher, tech led a broad sell-off, and traders now see another Fed rate hike before year-end as more likely than not.
The CPI print
Consumer prices rose 0.6% in September, lifting annual inflation to 3.7% from 3.4% in August, above the 3.6% economists expected. Core CPI, which strips out food and energy, rose 0.3% on the month and 2.6% year over year, against forecasts of 0.2% and 2.5%.
Energy drove most of the jump. Gasoline rose 9.1% in September and accounted for more than half of the monthly increase, as the war in Iran keeps pushing up crude and refined fuel prices. But core inflation is what worries the Fed: it ran at roughly a 3.7% annualized pace in September, so price pressures are spreading beyond the pump.
Bonds: the 10-year stays above 5%
The 10-year Treasury yield jumped about 9 basis points to 5.30% after the release. It then eased into the close, ending near 5.19% by official Treasury data. The 10-year has climbed roughly 1.2 percentage points in 2026 and touched 5.34% earlier this month, its highest level since 2002.
Higher long-term yields raise borrowing costs and weigh on growth-stock valuations. That pressure was visible in today’s session.
The Fed: hold now, hike later?
The Fed raised rates in mid-September for the first time in three years, and the next decision is due October 28. As of midday Wednesday, Kalshi priced that meeting at roughly 33% for a hike, 66% for a hold and 1% for a cut. Looking further out, prediction markets put the odds of another hike before 2027 at about 87%, with the December 9 meeting alone near 79%.
Fed officials had been trying to cool expectations. New York Fed President John Williams said recently there was no rush to act again, while leaving the door open to one more increase late this year. Today’s report makes that late-year hike look more likely.
Stocks: tech takes the hit
U.S. stocks had their worst day since July. The S&P 500 fell 1.1% to 7,718.94 for its fifth loss in six sessions since its all-time high, the Nasdaq sank 1.9%, and the Dow slipped just 0.1%. A deepening sell-off in semiconductor stocks, plus bank earnings and the inflation data, drove the decline.
Money rotated into defensive sectors. Health care (+2.44%), consumer staples (+2.21%) and energy (+0.65%) were among the S&P 500’s winning sectors. The VIX rose about 10% to 16.87. That is higher, but it is not a panic level.
Our Take
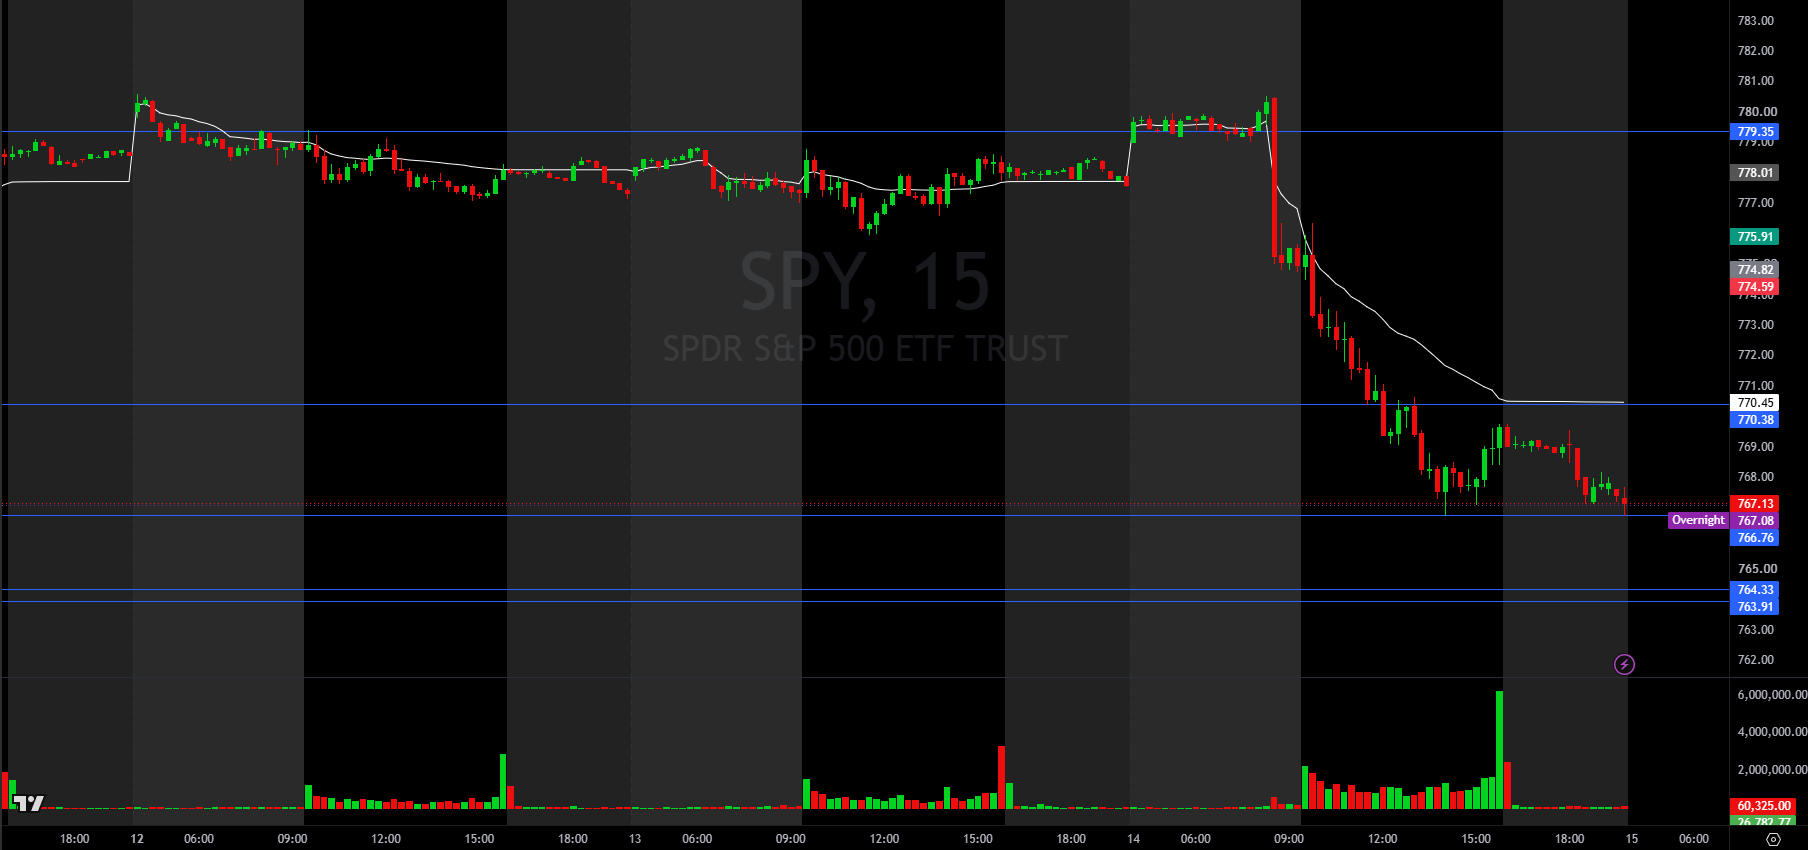
SPY opened near $780 this morning, but the CPI print rejected it right at the $779.35 level. From there it sold off steadily all session and never reclaimed VWAP. It closed at $769.60, just below the $770.38 level, and traded down to about $767 in the overnight session.
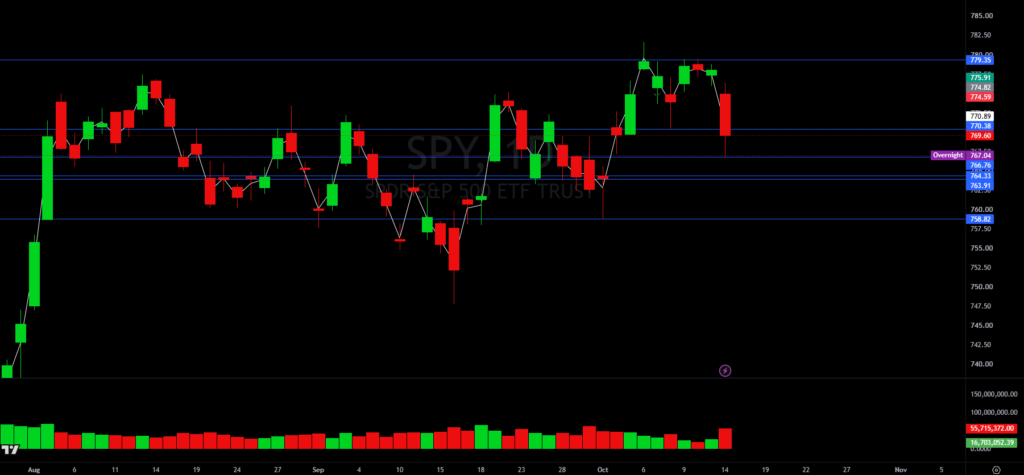
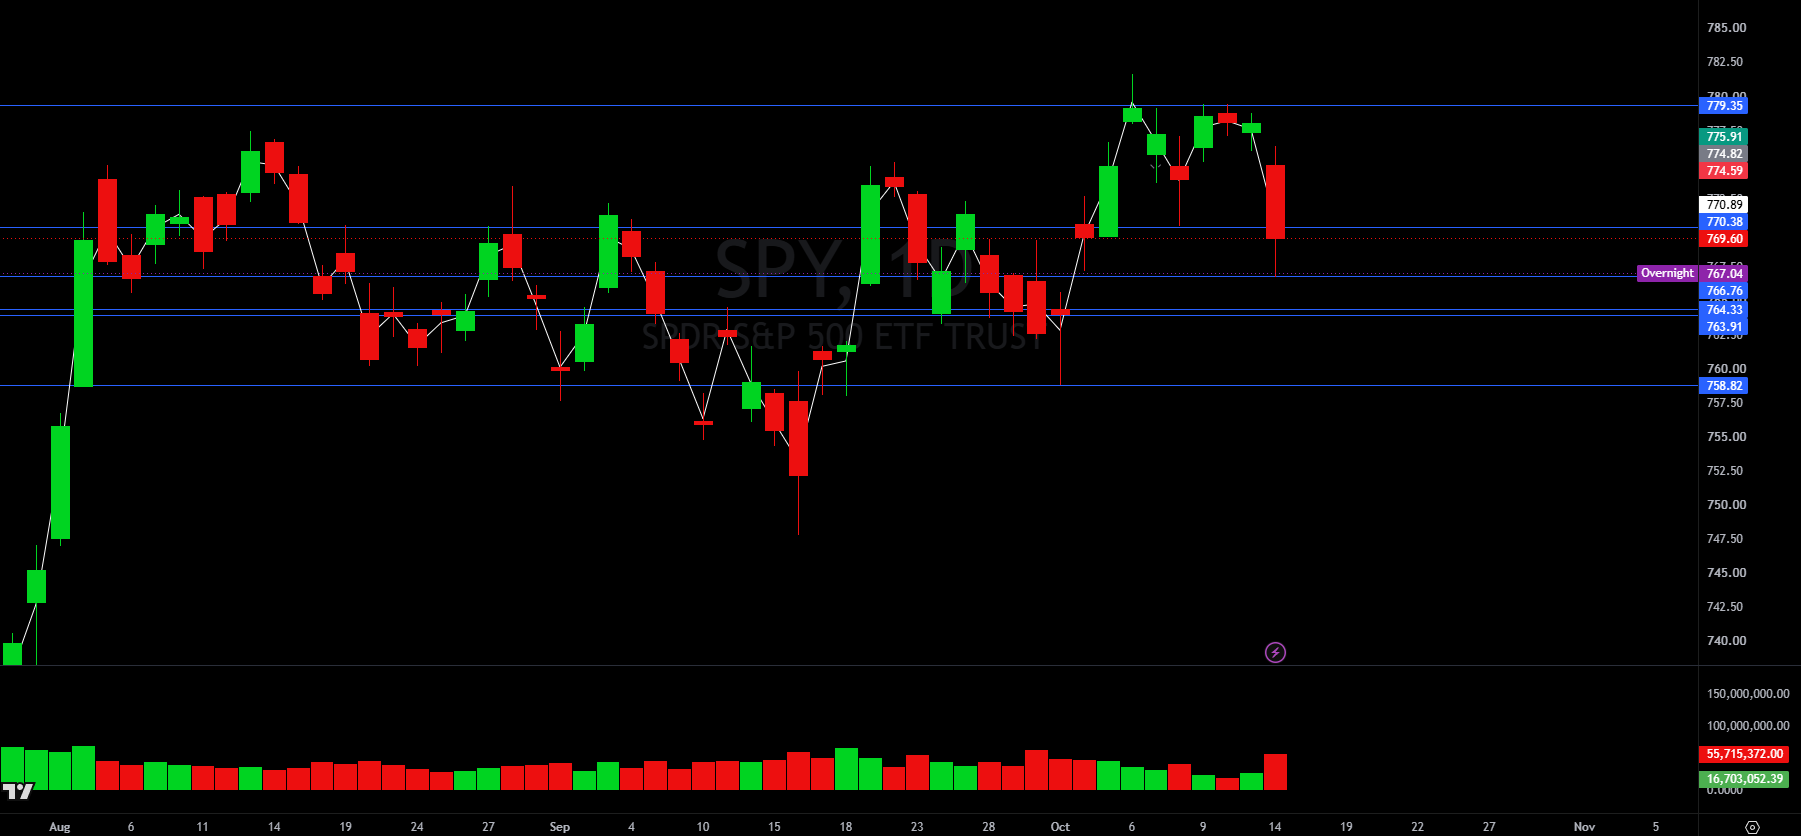
On the daily chart, SPY has been stuck in a wide range between $758.82 and $779.35 for several weeks. Today was a rejection at the top of that range, not a breakdown of the bigger trend. Volume was the heaviest in weeks (~55.7M shares) on a red candle that closed near its low. That’s a sign of distribution and gives sellers the short-term edge.
Key levels we’re watching on SPY
Resistance
- $770.38 (first bounce target): A relief bounce into this area is possible. Price needs to break and hold above it to start challenging the short-term downtrend.
- $774.59–$775.91 (trend-change confirmation): On the 15-minute chart, a higher low followed by a reclaim of this zone would confirm the selling pressure is over.
- $779.35 (top of the range): Bulls need to reclaim this level to fully erase the CPI drop.
Support
- $766.76: First support, already tested in the overnight session.
- $763.91–$764.33 (key zone): This is where many daily candles have opened and closed in recent weeks, so we expect buyers to defend it.
- $758.82 (bottom of the range): If the key zone breaks, this is the next major support.
- $748–$750: If SPY loses the range floor, the next target is the area of prior daily wicks.
Bottom line: As long as SPY stays below $770.38, the short-term bias is bearish, and any bounce into that level is likely to meet sellers. A reclaim of $775–$776 would shift the picture back toward a test of $779. A break below $763.91 opens the door to $758.82. Thursday’s PPI report (8:30 AM ET) could be the catalyst either way.
What to watch next
- Thursday, 8:30 AM ET: PPI. Economists expect wholesale prices to rise 0.6% month over month and 5.5% year over year.
- October 27–28: FOMC meeting and Fed rate decision.
- Oil: Brent is near $105 a barrel and WTI is near $95. Energy remains the main driver of headline inflation.
- November 10: October CPI report.
Disclaimer: This article is for informational purposes only and does not constitute financial advice. Trading involves risk, including the possible loss of principal. Always do your own research and consult a licensed professional before making investment decisions.
Sources: U.S. Bureau of Labor Statistics, CNN, CNBC, Kiplinger, Yahoo Finance, AOL/AlphaCheck, TheStreet, The Motley Fool, Kalshi, PredictionMarketsPicks, DeFi Rate, BeInCrypto, StockMarketWatch, Trading Economics.