
SPY Weekly Analysis: A 2.6% Rebound Leaves the ETF Just Above $748
By Tech & Money Press · SPY weekly analysis · Week of November 9–13, 2026
This is a look at the S&P 500 ETF’s weekly range and the levels on the daily chart. For a fuller account of the news that moved the market, see Saturday’s weekly market recap.
The week in numbers
SPY closed Friday, Nov. 13, at $754.37, up $19.08, or 2.6%, from the prior Friday’s close of $735.29, according to Webull regular-session data. The Associated Press said the S&P 500’s 2.5% weekly gain was its first winning week since October and its biggest weekly gain since August.
The weekly candle opened Monday at $741.95, reached a high of $763.04 on Thursday, made its low of $741.03 on Monday, and closed at $754.37. About 206 million shares changed hands over the five sessions.
Most of the week’s gain came on Monday, when SPY rose 2.4%, from $735.29 to $752.69. The next four sessions were mixed, and the ETF finished Friday 0.4% lower on the day.
| Day | Open | High | Low | Close | Change |
|---|---|---|---|---|---|
| Mon Nov. 9 | $741.95 | $755.42 | $741.03 | $752.69 | +2.4% |
| Tue Nov. 10 | $747.94 | $752.14 | $744.86 | $749.92 | −0.4% |
| Wed Nov. 11 | $756.80 | $762.51 | $754.90 | $759.81 | +1.3% |
| Thu Nov. 12 | $753.98 | $763.04 | $753.67 | $757.12 | −0.4% |
| Fri Nov. 13 | $760.07 | $760.12 | $747.88 | $754.37 | −0.4% |
Source: Webull regular-session daily bars. Monday’s change is from the Nov. 6 close of $735.29. The Monday low of $741.025 is rounded to $741.03.
In Sunday overnight trading, the last quote was $754.66 as of 8:03 p.m. ET, little changed from Friday’s close.
Where the week sits on the chart
The rebound followed a sharp drop the week before. SPY made a high of $775.64 on Nov. 4, a low of $732.71 on Nov. 5, and closed that week at $735.29.
This week’s close is still below the Nov. 4 high and below the Oct. 6 high of $781.62, which is also Webull’s 52-week high. It is well above the Nov. 5 low.
Friday’s session low was $747.88, about 14 cents above the Sept. 16 low of $747.74. In earlier SPY weekly notes, we marked $747.74 as the lower end of the range that had held since late summer. Friday’s low tagged that area and the ETF closed back above it, at $754.37.
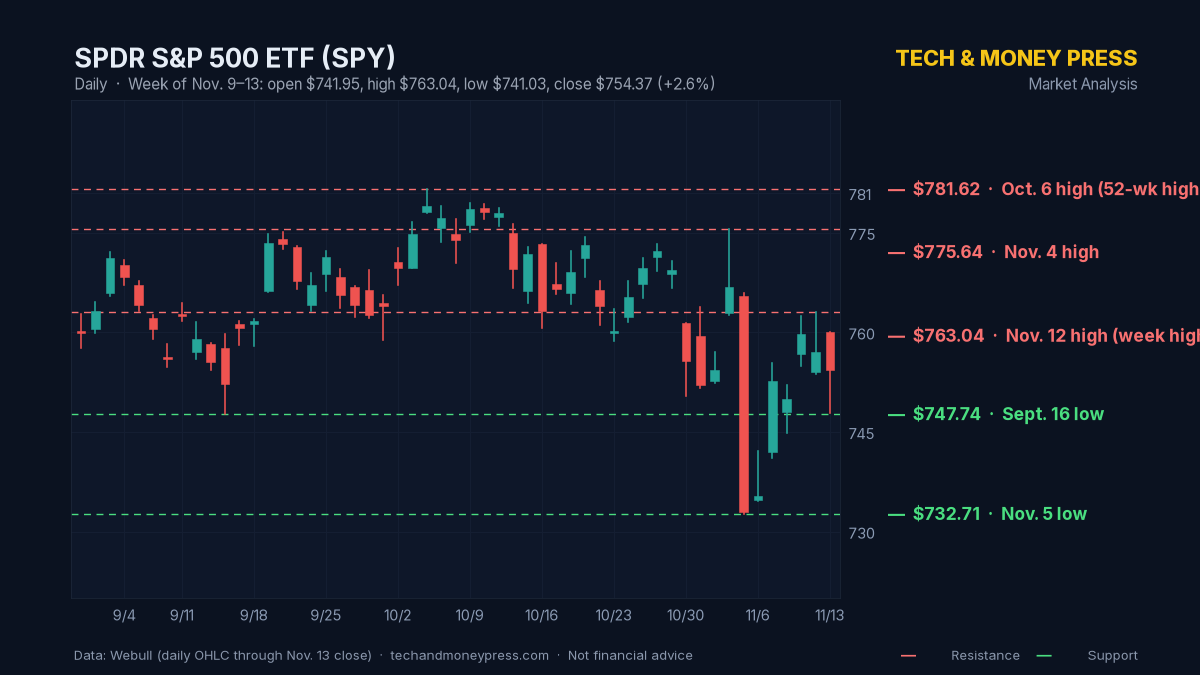
SPDR S&P 500 ETF (SPY) daily chart. Data: Webull.
Levels on the chart, as reference points from past trading: $763.04 (this week’s high, Nov. 12) and $775.64 (Nov. 4 high) above, with the Oct. 6 high of $781.62 further up; $747.74 (Sept. 16 low) and $732.71 (Nov. 5 low) below.
What moved the market
The week’s news ran through several of our earlier stories, so the summary here is brief.
On Thursday, Nvidia said Jensen Huang had resigned as president, chief executive and board member. The stock closed the week at $162.85, down 12.8% from $186.64 a week earlier, per Webull. Other chip shares rose earlier in the week and then gave back part of those gains on Friday, as we covered in our AMD and Broadcom stories.
Two large AI hardware suppliers reported Thursday after the close. Both came in above estimates, and both stocks fell on Friday: Cisco and Applied Materials.
Friday’s producer price index showed wholesale prices up 6.5% over 12 months, the largest annual increase since November 2022, according to the Bureau of Labor Statistics (our PPI story).
What’s Next
- Monday, Nov. 16: the New York Fed’s Empire State Manufacturing Survey for November, at or shortly after 8:30 a.m. ET. Federal Reserve Chair Kevin Warsh gives opening remarks at noon ET, according to the Fed’s calendar.
- Tuesday, Nov. 17: the Census Bureau’s advance October retail sales report at 8:30 a.m. ET, and the Federal Reserve’s industrial production and capacity utilization report at 9:15 a.m. ET. Home Depot holds its third-quarter earnings call at 9:00 a.m. ET. Nvidia reports fiscal third-quarter results at about 4:20 p.m. ET, with a call at 5:00 p.m. ET (our preview).
- Wednesday, Nov. 18: the Federal Reserve is scheduled to release the minutes of its Oct. 27–28 meeting at 2:00 p.m. ET. Target’s third-quarter call is at 8:00 a.m. ET, and TJX is scheduled to release earnings the same day.
- Thursday, Nov. 19: Walmart is scheduled to post fiscal third-quarter materials at about 7:00 a.m. ET (6:00 a.m. CT), with a call at 8:00 a.m. ET. Anthropic shares are scheduled to begin trading the same day, the company confirmed, The Verge reported.
Disclaimer: This article is for news and educational purposes only and is not financial advice. It does not predict results or stock moves. Price levels are shown as reference points from past trading, not as recommendations to buy or sell. Tech & Money Press is not a registered investment advisor. Trading stocks involves risk, including the loss of your investment. Do your own research and consult a licensed professional before making any investment decisions.
Sources: SPY regular-session daily and weekly bars, Friday close, 52-week high, and Sunday overnight last quote (8:03 p.m. ET, Nov. 15, 2026): Webull. Associated Press, via Saturday’s recap, on the S&P 500’s weekly gain. Weekly market recap, Nov. 9–13. Nvidia leadership change and Tuesday report: our Nvidia preview, which cites the company. U.S. Bureau of Labor Statistics, October PPI. New York Fed Empire State Manufacturing Survey calendar (Nov. 16 release; “Released at or shortly after 8:30 a.m.”). Federal Reserve calendar, November 2026 (Chair Warsh, noon ET Nov. 16; G.17 industrial production, 9:15 a.m. Nov. 17; Oct. 27–28 FOMC minutes on Nov. 18). Census Bureau Monthly Retail Trade release schedule (advance October report, Nov. 17, 8:30 a.m.). The Home Depot, Nov. 3, 2026: third-quarter call Nov. 17 at 9:00 a.m. ET. Target Investor Relations: Q3 2026 call, Nov. 18, 8:00–9:00 a.m. ET. TJX reporting calendar: third-quarter fiscal 2027 earnings release date Nov. 18, 2026. Walmart FY2027 Q3 earnings, Nov. 19: materials about 6:00 a.m. CT, call at 7:00 a.m. CT. The Verge, Nov. 2026: Anthropic confirms shares are planned to start trading Nov. 19. FOMC minutes time of 2:00 p.m. ET as listed on Kiplinger’s economic calendar for the week of Nov. 16–20, 2026.
Cover photo: The New York Stock Exchange floor, Sept. 26, 1963, not a current trading session. Photo: Thomas J. O’Halloran / U.S. News & World Report Collection, Library of Congress. No known copyright restrictions.