Our Take: October PPI Hits 6.5% as Wholesale Inflation Keeps a Fed Hike in Play
By Tech & Money Press · Our Take on the October 2026 producer price index · November 13, 2026
The October producer price index gave markets one number that looked better than feared and one that looked worse. Wholesale prices rose 0.3% in the month, a little below the 0.4% forecast. But over the past 12 months they rose 6.5%, the fastest pace since November 2022, according to the Bureau of Labor Statistics.
That mix did not change the bigger picture. Three days after a hotter-than-expected October CPI report, markets are still fully pricing in a Federal Reserve rate hike in December, CNBC reported. Stocks gave up early gains. The SPDR S&P 500 ETF (SPY) was trading near $750.13 at 10:55 a.m. ET, down about 0.9% from Thursday’s close of $757.12, according to Webull data.
What the October PPI showed
The PPI measures the prices that U.S. producers receive for their goods and services, before those products reach consumers. Here is what the October report showed, per the BLS release and CNBC:
- Headline PPI: up 0.3% in October, versus the 0.4% Dow Jones consensus. September was revised up to a 1.4% gain, InvestmentNews reported.
- Annual PPI: up 6.5% over 12 months, from 6.3% in September. InvestmentNews said economists had expected 6.6%.
- Core PPI (excluding food and energy): up 0.3%, matching forecasts, after a 0.7% gain in September.
- PPI excluding food, energy and trade services: up 0.5%, a measure some economists watch because it strips out volatile retail and wholesale margins.
- Goods: up 0.5% in the month and 10.2% over 12 months, the largest annual increase since October 2022, per CNBC.
- Services: up 0.2%, with much of the gain coming from transportation and warehousing. Truck freight prices rose 3.9% in October, per the BLS.
The BLS table also shows wide swings inside the goods category: food prices rose 1.3% in the month, with fresh and dry vegetables up 26.7%, while energy prices slipped 0.1%.
The pipeline numbers matter more than the headline
The most important part of the report may be the earlier stages of production. Prices for processed intermediate goods, the materials companies buy to make finished products, rose 14.6% from a year earlier, the biggest annual gain since July 2022. Intermediate services prices rose 6.9%, the most since November 2022, CNBC reported.
Those are the costs businesses face before they set their own prices. When they rise this fast, companies either absorb the cost and accept lower margins, or pass it on to customers. Either way, it tends to show up later in consumer prices or corporate earnings.
That is why one softer monthly reading is not the same as cooling inflation. The monthly gain slowed from September’s 1.4%, but the annual rate is still climbing.
What the Fed is saying
The Fed’s next meeting is Dec. 8–9. According to CNBC, markets are fully pricing in a quarter-point increase in the Fed’s benchmark rate, with small odds of a half-point move.
Fed officials have been clear that the problem is broad. “If you look at how broad-based the inflation is, it’s not just that we’re above the target and have been for some time,” Chicago Fed President Austan Goolsbee said in a CNBC interview Friday. He added that in categories not driven by oil or tariffs, “you’re still seeing stalled progress and in some cases going the wrong way.”
CNBC noted that policymakers are worried that price pressures from the Iran war, higher fuel prices and tariffs are spreading through the economy. The Fed usually looks past one-time shocks. It is harder to do that when price increases show up across many categories at once.
Chris Zaccarelli, chief investment officer at Northlight Asset Management, told CNBC the PPI data is “unlikely to change the Fed’s approach in December because the CPI data was already outside their comfort zone.”
How markets reacted
The bond market has been the clearest signal this week. The 10-year Treasury yield was at 5.17% Friday morning, up from 5.13% at Thursday’s close and from about 4.85% a week earlier, Investopedia reported. Yahoo Finance said the yield reached its highest level since October.
Stocks wobbled. Yahoo Finance reported the S&P 500 down 0.8% and the Nasdaq down 1.6% shortly before 11 a.m. ET, with chip stocks leading the decline as Nvidia’s leadership turmoil continued. Bitcoin dropped below $70,000 for the first time in nearly three months, according to Yahoo Finance.
Even so, the S&P 500 and Nasdaq entered Friday up roughly 3% for the week, Investopedia noted, and fund flows have stayed strong, as we covered in our look at this week’s ETF inflows.
Our Take
We read the October PPI as a “softer month, hotter year” report. The monthly headline came in below forecasts, but it does not change the direction of travel. Annual wholesale inflation is at a four-year high, goods prices are up more than 10% from a year ago, and the costs at the start of the supply chain are rising even faster.
For the Fed, this report removes any doubt that CPI might have been a one-off. With CPI hotter than expected and PPI still accelerating on an annual basis, a December hike looks like the base case markets have already priced in. The more open question is what the Fed signals about 2027, and whether officials see more than one increase.
For stocks, the pressure point is the 10-year yield. A move from about 4.85% to above 5.1% in one week raises borrowing costs and makes bonds more competitive with stocks. That matters most for high-valuation growth names, which helps explain why tech fell more than the Dow on Friday. Companies with strong pricing power are better placed to handle rising input costs than those that must absorb them, a theme we saw in Cisco’s margin squeeze this week.
The next data points to watch are the November CPI and PPI reports and the Fed’s Dec. 9 decision and projections. The BLS lists the November PPI for Dec. 15.
The levels on the chart
Based on Webull data, these are the reference points on the SPY daily chart:
- $781.62: the Oct. 6 intraday high, the top of the chart window.
- $757.12: Thursday’s close, the day before the PPI report.
- About $750.13: the regular-session quote at 10:55 a.m. ET on Nov. 13.
- $732.71: the Nov. 5 intraday low, the lowest point in the chart window.
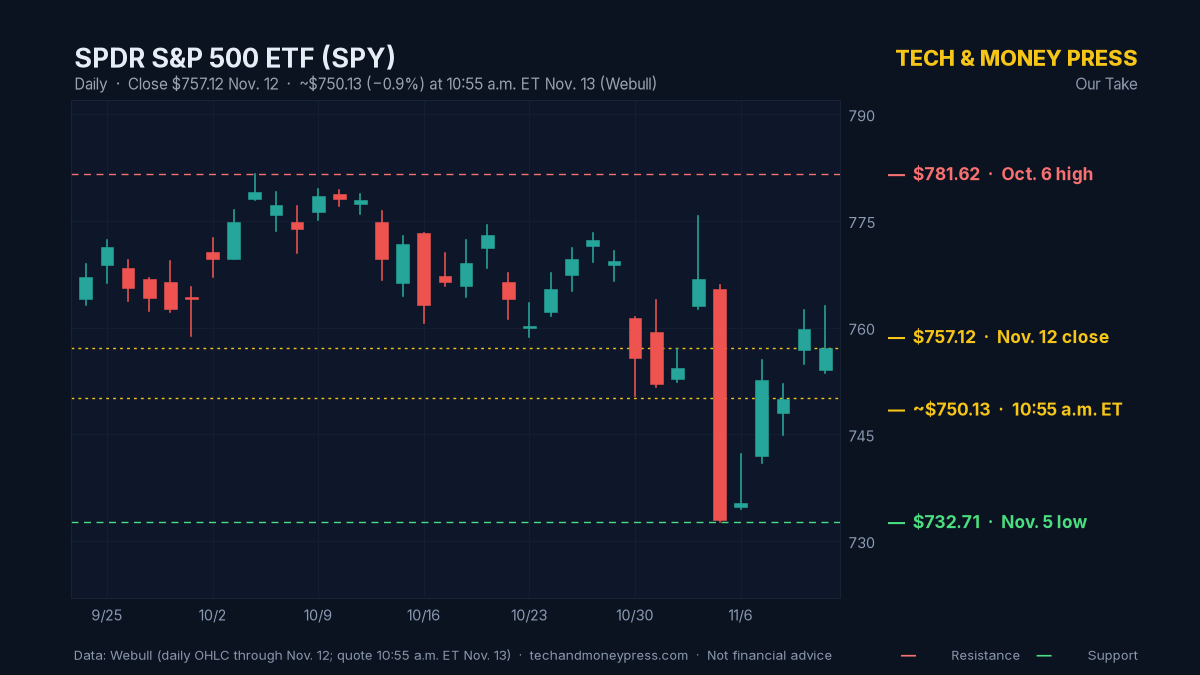
Intraday prices change through the session; the quote above is a snapshot.
Key takeaways
- October PPI rose 0.3%, below the 0.4% forecast; core PPI rose 0.3%, as expected (BLS, CNBC).
- Annual PPI accelerated to 6.5% from 6.3%, the highest since November 2022 (BLS, InvestmentNews).
- Goods prices are up 10.2% over 12 months; processed intermediate goods are up 14.6% (CNBC).
- Markets fully price in a quarter-point Fed hike at the Dec. 8–9 meeting (CNBC).
- The 10-year Treasury yield was 5.17% Friday morning, up from about 4.85% a week earlier (Investopedia).
- SPY was near $750.13 at 10:55 a.m. ET, down about 0.9% from $757.12 (Webull).
Disclaimer: For news and education only. Not financial advice. Tech & Money Press is not a registered investment advisor. Trading stocks involves risk, including the loss of your investment. Do your own research and consult a licensed professional before making any investment decisions.
Sources: U.S. Bureau of Labor Statistics: Producer Price Index, October 2026, Nov. 13, 2026. CNBC: Wholesale prices rose 0.3% in October, putting annual rate at 6.5%, Nov. 13, 2026. InvestmentNews: PPI still ‘uncomfortably high’ as December rate hike looms. Investopedia: Stock market today, Nov. 13, 2026. Yahoo Finance: Stock market today, Nov. 13, 2026. SPY daily prices and 10:55 a.m. ET quote: Webull.
Featured image: Shopping cart with coins. Photo: AlexBarcley / Pixabay.